I was recently asked about how electropherograms appear if the same sample vial is injected multiple times on an instrument. In order to hopefully provide a helpful example, I have scanned some actual data that I have obtained in the past.
The data below are from the repeated 5s injection of a 9947A sample on a single capillary ‘310’ instrument (Blue Identifiler loci shown) run as a part of a precision study.
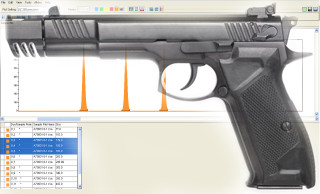
The data below are from 5s and 10s injections of the same, low level DNA sample on the same 310 run (all Identifiler loci shown)
Here is some additional data showing 5s and 10s injections of the same sample on the same 310 run (Identifiler)
Thank you so much, that is brilliant, fantastic. The 5s10s example is I think is in some ways more convincing, because the RFU are much lower, with examples in the 50 RFU – 100 RFU. These scans certainly confirm the point – that gross inversions in the results from on repeat runs on the same sample are impossible on a properly functioning uncontaminated machine with proper procedures.
An example like the 9957A precision study, but run on a very low DNA concentration (so with peaks of the order 50 RFU) would be even more convincing, and even more so if run on all colours ( I know someone will claim blue works better than red or something! ). I should say, it’s not me that needs convincing, I’m convinced on essentially “theoretical” grounds, it’s people who have a strong prejudice that the results in Amanda’s case have some validity.
One clarification : I assume that the “s” as in 10s / 5s is referring to the time in seconds for the injection process. Yes? So there is possibly a trade-off between obtaining high peaks and narrow peaks, both of which are desirable, and the operator of the machine can select the injection time? Is there a “standard” time for the injection process?
George,
5s is considered the standard injection time. Longer injection times result in more DNA being introduced into the capillary. This will result in taller peaks, but as you noted they will also widen. 10s seems to be the longest injection time that will produce acceptable peak widths. I wish I had an example of a low level sample being injected numerous times a la the precision study, but I don’t believe I have that. I may have some other examples of duplicate injections of low level samples I can post.
Just posted some more examples. 5s=5 seconds and 10s=10 seconds, referring to the electrokinetic injection time which introduces DNA from the sample vial into the capillary.
Is the increased injection time (5 and 10 sec) allowing the DNA molecules to “stack” or start at the same position versus a 3 sec injection time?
HI Tom,
Thanks for your comment. 5s is a pretty standard injection time in forensic DNA CE. The system is designed to produce a narrow sample zone and stacking does occur. AT 10s wider peaks can occur, but they are still acceptable. It seems as if injection times go beyond 10s, the peak morphology becomes too wide. It is important to run controls at the same injection time as samples to allow for any sort of differences in sensitivity, etc.
A longer injection time means that voltage is being applied to the sample for a longer time, allowing more DNA to be attracted into the capillary.